P2P Scholars Program - By The Numbers
Cohorts |
Totals |
Inside Totals |
Outside Totals |
2016/17 Totals |
2018 Totals |
2019 Totals |
2020 Totals |
2021 Totals |
2022 Totals |
2023 Totals |
Applications |
1703 |
803 |
900 |
15 |
36 |
405 |
177 |
479 |
196 |
395 |
Started Program |
549 |
239 |
310 |
15 |
17 |
123 |
71 |
117 |
80 |
126 |
Completed Workshops (Part-1) |
337 |
97.5 |
239.5 |
15 |
14 |
62.5 |
20.75 |
85.25 |
62.5 |
77 |
P2P Scholars vs. Non-P2P and Non-FIP (Table 1)
Matriculation
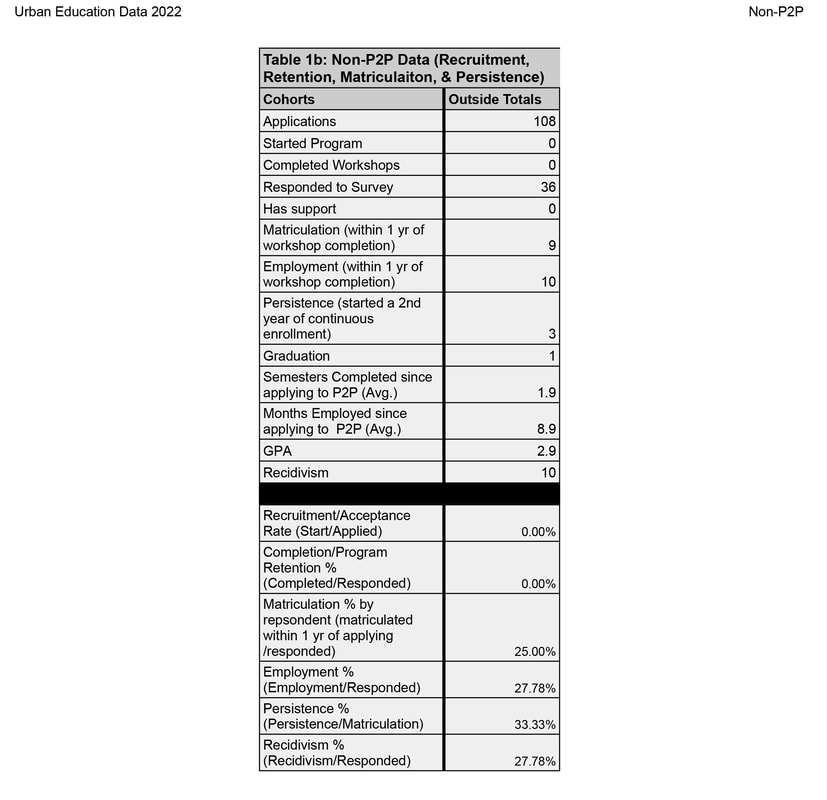
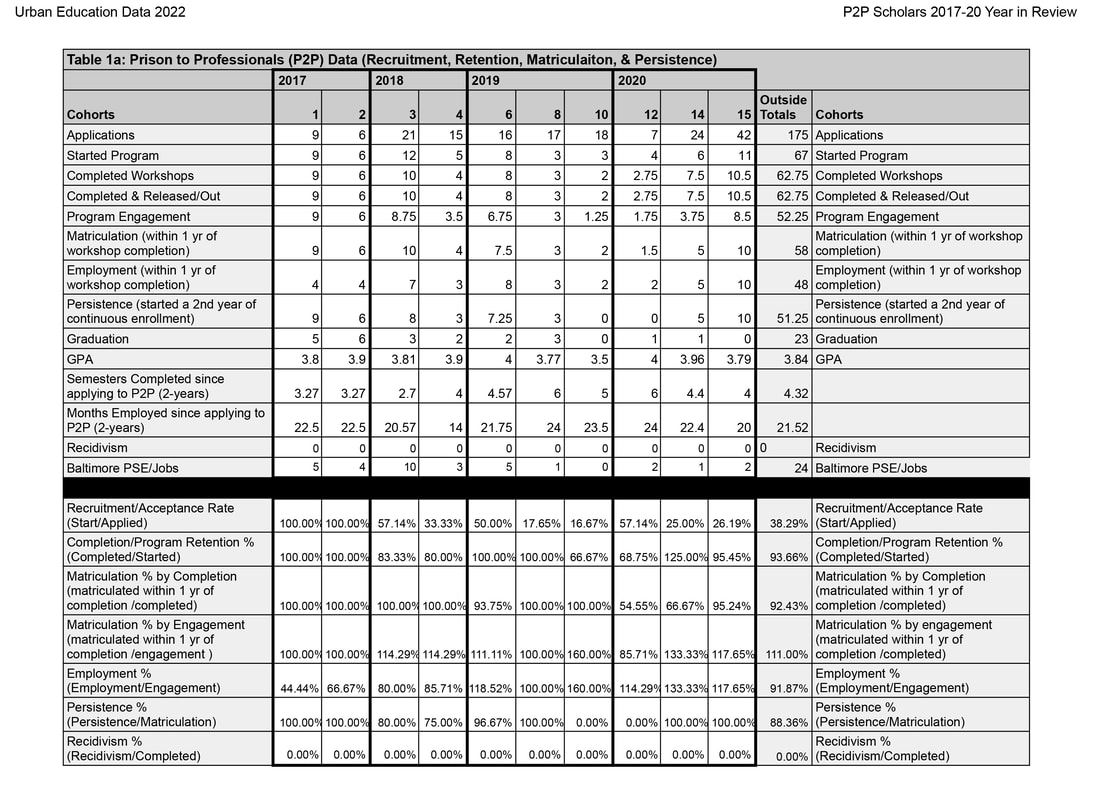
From January 1, 2017, to December 31, 2020, 175 formerly incarcerated people applied to the P2P Scholars Program, and 67 (38.29%, Table 1a) started the program. Of the 67, 63 completed the 2-months workshop portion of the program (Part-1), a 93.66% completion rate (Table 1a); and 52 of the 67 (78%) stayed engaged with the structured support and mentoring network for up to 2-years. Of the 63 that completed the program, 58 (92.4%) matriculated into PSE and 100% or all 52 people that stayed engaged with P2P matriculated into PSE. Compared to the FIP that applied to P2P but did not start the program, only 25% (Table 1b) matriculated into PSE. The P2P Scholars group had a higher matriculation rate (92.4% vs. 25%) than the non-P2P group.
From January 1, 2017, to December 31, 2020, 175 formerly incarcerated people applied to the P2P Scholars Program, and 67 (38.29%, Table 1a) started the program. Of the 67, 63 completed the 2-months workshop portion of the program (Part-1), a 93.66% completion rate (Table 1a); and 52 of the 67 (78%) stayed engaged with the structured support and mentoring network for up to 2-years. Of the 63 that completed the program, 58 (92.4%) matriculated into PSE and 100% or all 52 people that stayed engaged with P2P matriculated into PSE. Compared to the FIP that applied to P2P but did not start the program, only 25% (Table 1b) matriculated into PSE. The P2P Scholars group had a higher matriculation rate (92.4% vs. 25%) than the non-P2P group.
Employment
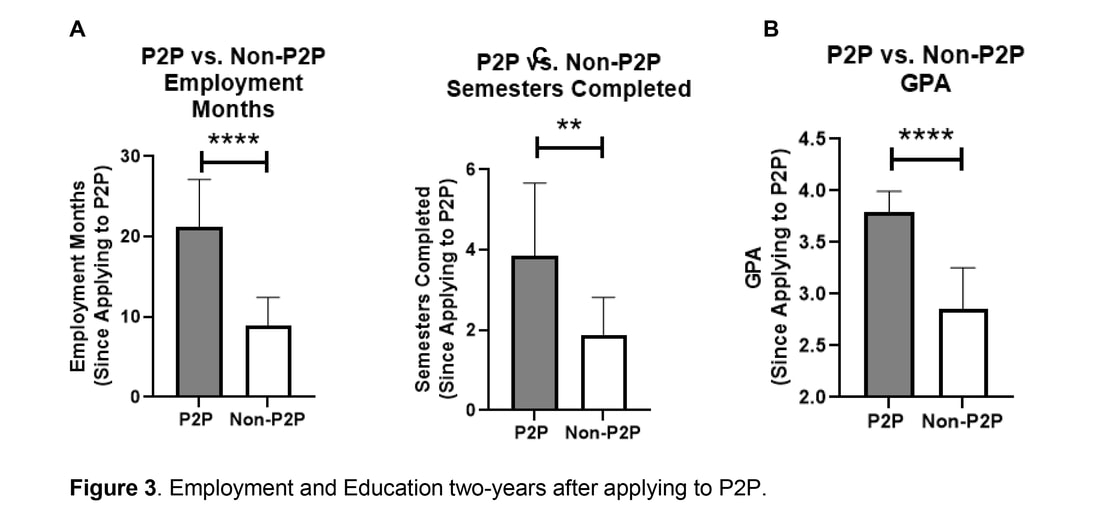
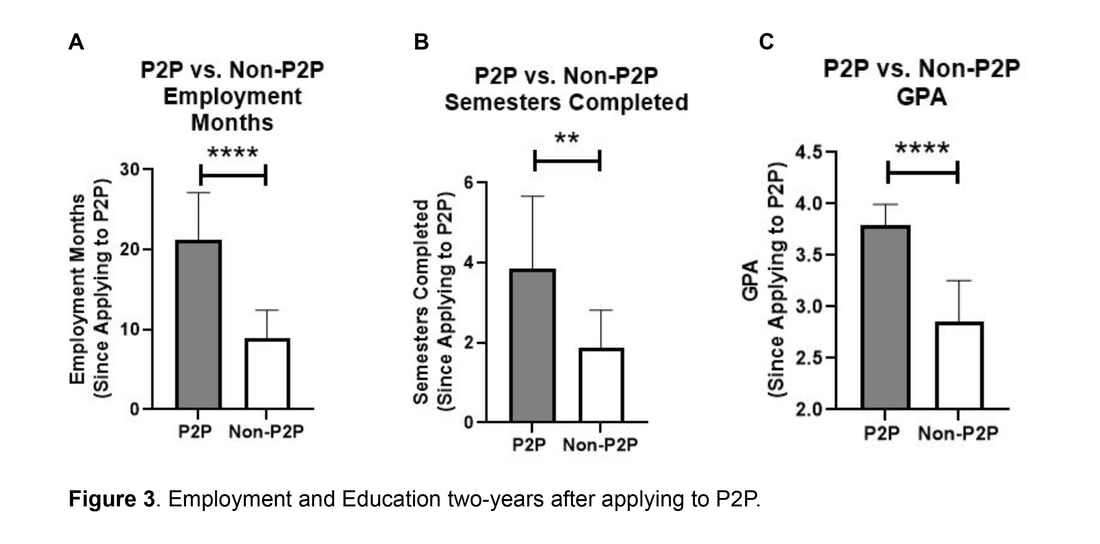
Of the 63 individuals who completed the workshop portion of the program, 11 were not additionally seeking employment assistance because they already had employment (nine) or wanted to focus on school alone (two). Of the 52 that were seeking employment, 48 (91.9%) were connected to employment within one-year and stayed on that job for more than three-months (Table 1a). In comparison, the non-P2P group (all of whom were seeking employment) had an employment rate of 27.78% (Table 1b). Thus, The P2P Scholars group had a higher employment rate (91.9% vs. 27.78%) than the non-P2P group. This 91.9% is also higher than the national employment rate of 73% for people with convictions (Couloute & Kopf, 2018). When comparing months employed in the two years since applying to P2P, P2P Scholars had a significantly higher number of consecutive months employed compared to the non-P2P group (21.52 months vs. 8.9 months, p<0.0001, Figure 3a).
Of the 63 individuals who completed the workshop portion of the program, 11 were not additionally seeking employment assistance because they already had employment (nine) or wanted to focus on school alone (two). Of the 52 that were seeking employment, 48 (91.9%) were connected to employment within one-year and stayed on that job for more than three-months (Table 1a). In comparison, the non-P2P group (all of whom were seeking employment) had an employment rate of 27.78% (Table 1b). Thus, The P2P Scholars group had a higher employment rate (91.9% vs. 27.78%) than the non-P2P group. This 91.9% is also higher than the national employment rate of 73% for people with convictions (Couloute & Kopf, 2018). When comparing months employed in the two years since applying to P2P, P2P Scholars had a significantly higher number of consecutive months employed compared to the non-P2P group (21.52 months vs. 8.9 months, p<0.0001, Figure 3a).
Persistence, GPA, and Graduation
When looking at persistence, 51 of the P2P Scholars persisted on to a second continuous year of PSE. Calculated based on the 63 who completed the workshop portion of the program, the persistence rate was 88.4% (Table 1a). More accurately, calculated based on the 58 that matriculated into PSE initially, the persistence rate was 92.3%. Comparatively, three of the nine people (33.33%) who matriculated from the non-P2P group persisted into the second year of PSE (Table 1b). When looking at semesters completed in the two years since applying to P2P, P2P Scholars had a significantly higher number of semesters completed compared to the Non-P2P group (4.32 vs. 1.9, p<0.01, Figure 3b) Astonishingly, the 58 P2P Scholars that started PSE maintained a GPA of 3.84 (Table 1a), which was significantly higher than the non-P2P group that had a GPA of 2.9 (p<0.0001, Figure 3c). Twenty-three of the P2P Scholars graduated during the 2017-2020 timeframe (Table 1a). This was 100% of those eligible to graduate in that timeframe whereas only one of the 9 people from the non-P2P group graduated (Table 1b).
In comparison to national student data, among all students who enrolled in college for the first time in fall 2017, 73.8 percent persisted at any US institution in fall 2018, while 61.7 percent were retained at their starting institution (National Student Clearinghouse Research Center, 2019). According to national data, the average GPA for students at four-year colleges in the US was around 3.15, or a B average (P., 2020). P2P Scholars outperformed national college student data in their persistence rate (92.3% vs. 73.8%) and in their average GPA (3.84 vs. 3.15).
Recidivism
Recidivism alone is not the most valuable metric to determine a person’s wellbeing and successful return to society. A person could stay out of prison and not be employed, not be in school, not be connected to family and support, not be physically and mentally well, and not be a productive member of society. Has that person successfully reentered society just because they didn’t go back to prison in those first one-two years? The field has come to realize that recidivism should not be the main metric of success for public safety nor the safety of the individual and their family. Incredibly, however, the recidivism rate (calculated as reincarceration due to a new criminal conviction within two-years of applying to P2P) for P2P Scholars was zero percent from 2017 to 2020. In comparison, the non-P2P group had a recidivism rate of 27.78%. The national recidivism rate floats around 40-75% depending on how it's calculated (Benecchi, 2021).
Recidivism alone is not the most valuable metric to determine a person’s wellbeing and successful return to society. A person could stay out of prison and not be employed, not be in school, not be connected to family and support, not be physically and mentally well, and not be a productive member of society. Has that person successfully reentered society just because they didn’t go back to prison in those first one-two years? The field has come to realize that recidivism should not be the main metric of success for public safety nor the safety of the individual and their family. Incredibly, however, the recidivism rate (calculated as reincarceration due to a new criminal conviction within two-years of applying to P2P) for P2P Scholars was zero percent from 2017 to 2020. In comparison, the non-P2P group had a recidivism rate of 27.78%. The national recidivism rate floats around 40-75% depending on how it's calculated (Benecchi, 2021).
